🌊 Ottawa River: Global Warming or Negligence? Help Us Find the Truth.
The Ottawa River flooded in 2017, 2019, 2023, and again this year. Every single time, the same debate erupts — climate change vs. dam mismanagement. Politicians pick a side. Agencies release aggregate numbers. Residents are left with viral photos and Facebook groups trying to figure out what happened to their homes. We're done with that.
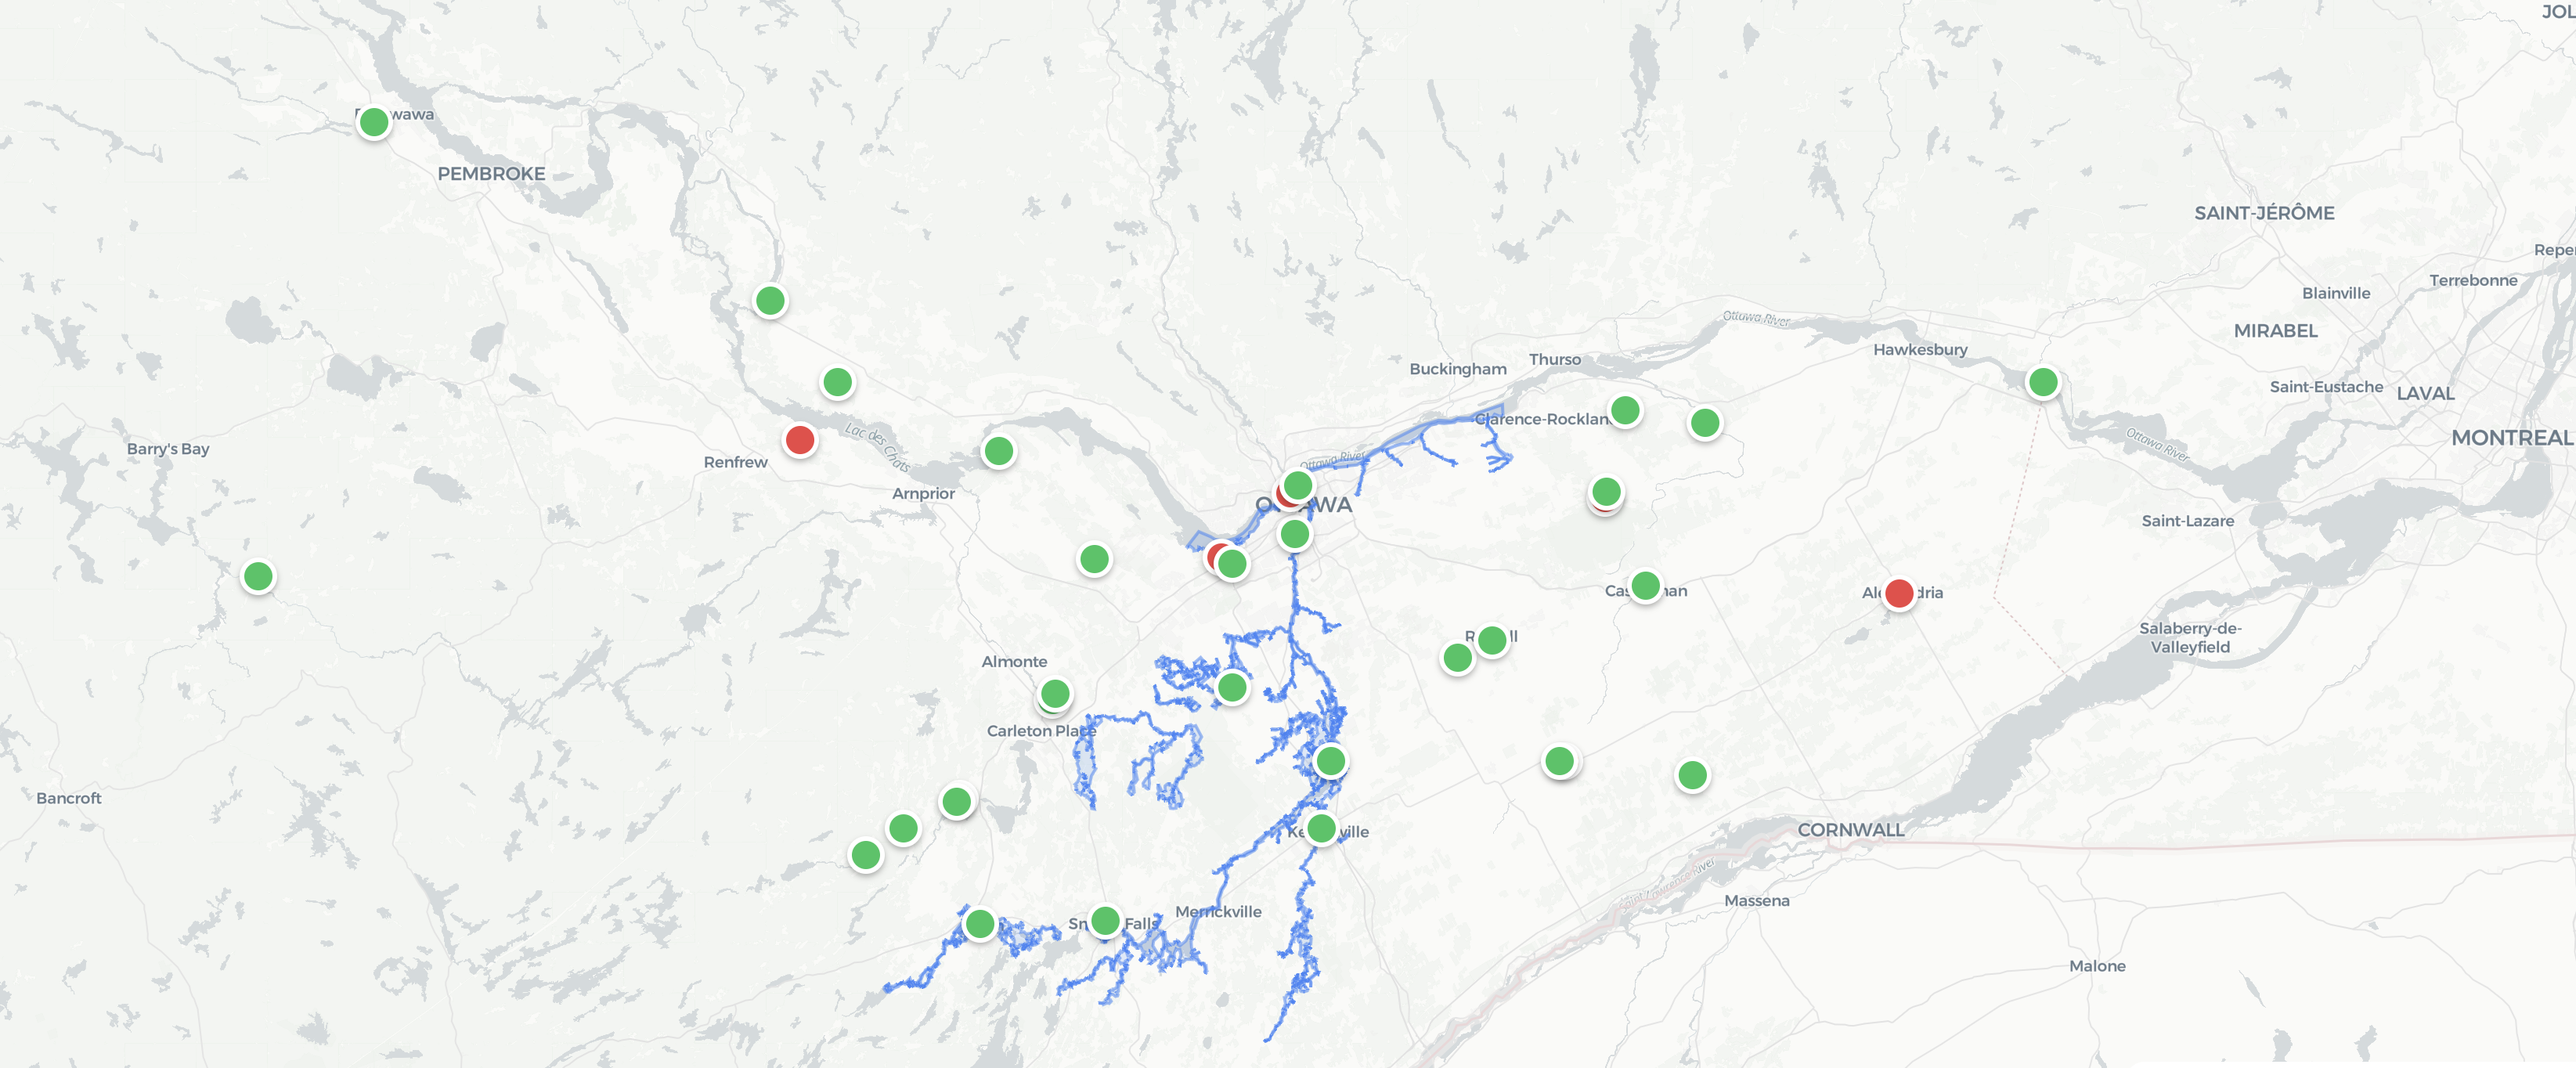
Real-time water monitoring for the Ottawa River watershed
One platform for the entire watershed
Live gauges, flood mapping, community reports, and AI-curated intelligence — so you can see what matters in one place.
- Live Data Collection
- The dashboard is live at ottawariverinfo.com/en/dashboard — real-time sensor data, flood maps, and AI-curated alerts.
- 📍 Report What You're Seeing
- If you live along the river — report water levels, timing, anything. Every observation helps build the timeline.
- 📊 Share Your Data
- Historical data, photos with timestamps, flood damage records — that's evidence. Help us document what really happened.
- Intelligence Feeds
- AI-curated news and alerts from local sources, updated continuously
- Multi-Source Monitoring
- Aggregates news from CBC, CTV, local papers, government releases, and social channels
- Smart Severity Ranking
- AI classifies alerts by urgency — critical warnings surface first, updates follow
- Ottawa River drainage basin (approximate area)
- ~146k km²
- Provinces along the river — Ontario & Québec
- 2
- Major spring floods since 2017 in the public record
- 4
Is flood prevention the #1 operational priority for Ottawa River dam operators during spring freshet — or is it hydroelectric revenue?
That question has a real answer. It's in the gate release logs, the pre-drawdown decisions, the power purchase agreements. We're building the data layer to surface it. My Ottawa River (ottawariverinfo.com) is an open, real-time water monitoring platform for the entire watershed. Live sensor data. Flood maps. AI-curated alerts. But right now it's a map waiting for the data that will actually settle the debate.
📍 Report What You're Seeing
If you live along the river — report water levels, timing, anything. Every observation helps build the timeline.
📊 Share Your Data
Historical data, photos with timestamps, flood damage records — that's evidence. Help us document what really happened.
🔗 Spread the Word
If you know someone affected, share this. Every data point matters in building the complete picture.
Intelligence Feeds
AI-curated news and alerts from local sources, updated continuously
This isn't a conspiracy. It's a falsifiable hypothesis.
Either the operators did everything flood prevention required and climate forcing overwhelmed the system — or they didn't. Both outcomes are measurable. Both have very different policy consequences.
Live Data Collection
The dashboard is live at ottawariverinfo.com/en/dashboard — real-time sensor data, flood maps, and AI-curated alerts.
Evidence Gathering
We need gate release logs, pre-drawdown decisions, power purchase agreements — the data that answers the question definitively.
Build the Map
Help us build the data layer that makes sense of it. Report observations, share historical records, spread the word.
News Intelligence That Never Sleeps
Our AI scouts continuously monitor local news, government bulletins, and social feeds to surface flood-related alerts the moment they break — so you're never caught off guard.
Multi-Source Monitoring
Aggregates news from CBC, CTV, local papers, government releases, and social channels
Smart Severity Ranking
AI classifies alerts by urgency — critical warnings surface first, updates follow
Location-Aware
Alerts are geo-tagged to show exactly where incidents are happening on the map
Resources
Stay prepared. Stay informed.
Government Agencies
Emergency Preparedness
- Flood safety tips
- Emergency contacts
- Evacuation information
Data Sources
- Where we get our data
- Open data licenses
- API information
Contact
- Report an issue
- Send feedback
- Media inquiries
See the river in real time — and help fill in the gaps.
Open the live dashboard for gauges, flood layers, and alerts. Report what you're seeing so the record gets stronger.